
2019年11月04日
IELTS Writing Part 1 Table (表) 対策
IELTSライティングテストのTask1では、標準20分で与えられたグラフ、表、図解、地図
の情報を150語以上で説明することが求められます。
情報をわかりやすく比較することが必要です。つまりグラフなどの最も重要な部分(主な特徴)
を見つけ、それに沿って説明します。細かな部分は省略しても構いません。
Task 1の出題パターンは、棒グラフ、表、円グラフ、折れ線グラフが全体の90%を占めます。
それに加え、出題は比較的少ない(約10~15%) ながら、図解、地図もあるので
全てしっかりと準備しておきましょう。
それでは、今回 Table (表) の回答ポイントに続き、問題と回答例を挙げていきます。
Table (表) 回答ポイント

● 常に最大および最小の比率を強調表示する
● 異なる期間で数値がある場合は、主要な増加、減少、変化、 傾向を強調表示する
● 各表データについて個別に書くのではなく、類似点と相違点に焦点を当てて、
Table (表) 全体でカテゴリを比較する
● 同じ文構造を繰り返し続けない。Table (表)について書くときの重要な表現は、
proportion (割合)と percentage (割合)
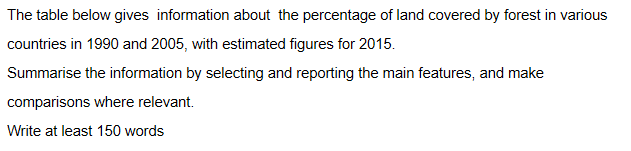
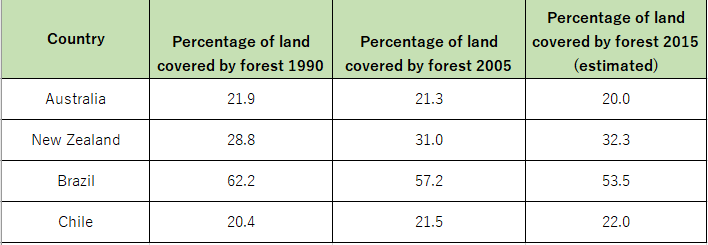
┃ Table (表) 問題例
You should spend about 20 minutes on this task
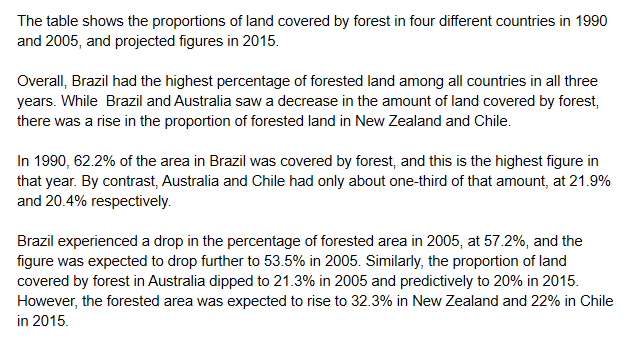
┃回答例