
IELTS Writing Task 1 評価基準(band descriptors) Band 7 の1つを見てください。
“Presents a clear overview of main trends, difference or stages.”
Band 7 では、出題されるグラフ、表、チャートや図解(Diagram)の概要(Overview)を説明する際、
trends, difference or stagesを明確に表現することが求められます。
概要(Overview)は、チャートやグラフ、 図解(Diagram) などが示す特徴のことで、
Introductionの中で必ず書くようにしましょう。
今回は、概要(Overview)の中で「Differences」を明確に表現する方法について解説していきます。
概要の中で「Differences」を表現する主なポイント
出題されたグラフ等に「Trends」がないデータがあります。数値の上昇や下降、
停滞や急上昇などが見られないデータです。
しかしながら、グラフ等のデータの中でカテゴリを比較したり数値の違い(Differences)が
示されている場合、データの比較や違い(Differences)を概要(Overview)で明確に説明する
必要があります。

出題されたグラフ等の中で、主な特徴を見つけるために、以下のような
比較の表現を意識しながらグラフ等を見るようにします。
more / fewer
例:more tea sales than coffee and cocoa sales.
higher / lower
例:cocoa sales were lower than other sales
┃問題例 1
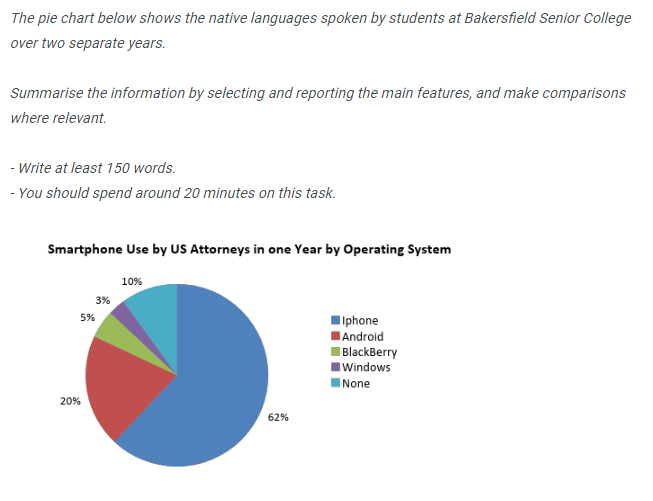
┃概要(Overview) 回答例
Overall, a clear majority of attorney prefer using the iphone operating system on their smartphones, though other system are also regular used.

┃問題例 2
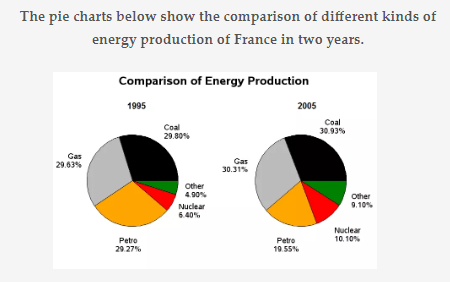
┃ 概要(Overview) 回答例