タスク1は2つのパートから成ります。タスクの見出し、あるいはトピックが提示され、指示文がその下に続きます。タスク指示文は常に同じで、以下のとおりです。
(主な特徴を選び記述することによって情報を要約し、妥当な場合には比較しなさい)↑
指示に従い、タスクの見出しと図解から読み取った情報で、まず、導入パラグラフ(イントロダクション)を書き出します。
▮ 導入パラグラフ(イントロダクション)
グラフ・図表が何を表しているのか1,2文で表現します。たいていの場合が設問の言い換え(paraphrasing)になります。指示の第1文の単語をいくつか流用したり、同義や類義の表現を知っていれば、導入パラグラフを早く書き上げることができます。
以下は、タスク指示の「言い換え」例です。
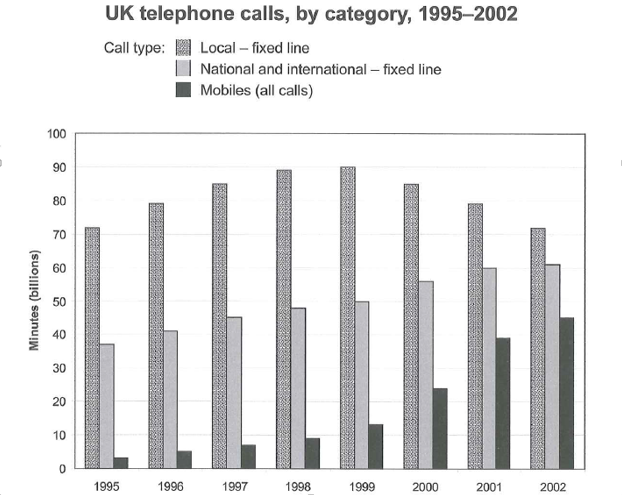
The chart shows the time spent by UK residents on different types pf telephone calls between 1995 and 2002.
時間短縮を意識しすぎて指示書をそのままコピーすることは避けてください。
IELTS試験管はタスク指示書のコピーを評価しないと言われています。
グラフや図表でよく使われる「同義語」「類義語」を覚えておきましょう。
graph → chart , show → illustrates,
the unemployment rates → the proportion of unemploymentと同じ意味です。
from 1995 to 2002 (又はfrom 1995-2002) はbetween 1995 and 2002 と言い換えます。
★ 導入パラグラフ: 書き出しサンプル をいくつも覚えておきましょう。
The line graph shows information about …
The pie chart illustrates the number of …
The bar graph gives data of …
The table provides the percentage of …
The diagram illustrates the process of …
The graph/table shows/indicates/illustrates/reveals/represents…
It is clear from the graph/table…
It can be seen from the graph/table…
As the graph/table shows,…
As is illustrated by the graph/table,…
From the graph/table it is clear….


